Today’s market produced several gaps in prices: gold gapped up to the highest since early February 2013. The 10-year and 2-year Treasury yields both gapped down to the lowest since July 2016, while the 30-year yield’s gap extended to a new record low.
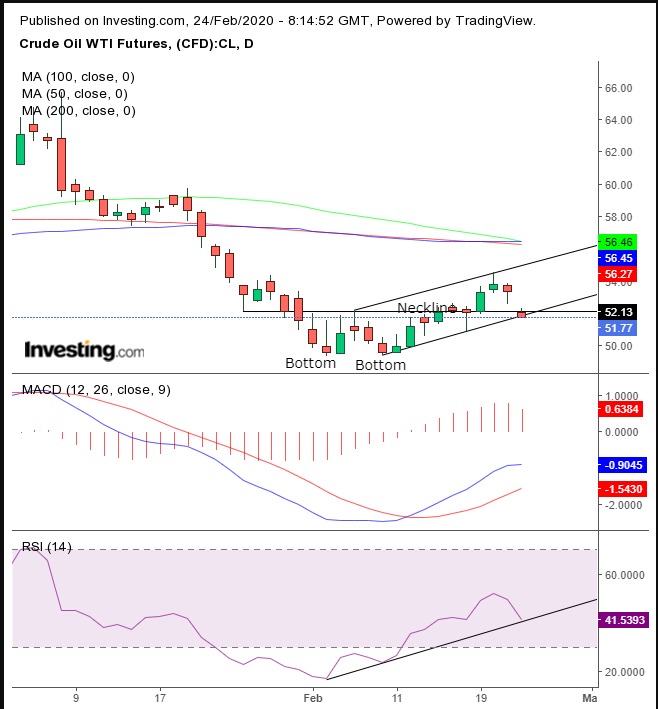
Crude opened lower, though its falling gap has no technical significance. Indeed, despite the concerns around global events and the coronavirus effect, the selloff could be a useful buying opportunity, as the chart below suggests.
A gap is by definition a market consensus, as there is no one else to take the opposite side of the trade. A falling gap, therefore, means that sellers’ orders will “slip” till they find new demand that supports prices.
While there are Breakaway Gaps, starting a new move; Measuring or Runaway Gaps, amid the move; and Exhaustion Gaps, at the end of a move, Common or Area Gaps occur within a congestion and have no predictive value.

WTI Daily Chart
Oil’s falling gap today is likely to have caused traders’ hearts to sink, but the move is not part of a market mechanism whose chain reaction is expected to lead to anything coherent.
What did catch our attention, however, is that despite the escalation in fears over the spread of the coronavirus, for now, at least, the commodity’s price has found support at the bottom of the rising channel since the February low, which also formed a small double-bottom.
While the price is slightly beneath the neckline, a three-cent rise would bring it above it. The MACD’s short MA has crossed above the long MA from an oversold position, confirming the price bottom happened across various price measures.
The RSI too is still above its uptrend line since its bottom, allowing for momentum to support price. Finally, the 50 DMA has yet to fall below the 200 DMA, allowing for it bounce above the major MA, with a price rise.
In other words, despite the terrible sentiment, and even after a 3% plunge, there is still demand for oil.
Conservative traders might seek a better price, waiting for a return to $50 before risking a long position in the current environment.
Moderate traders would wait for a close above the $52.12 neckline and perhaps seek confirmation with a bullish candle, before committing to a long position.
Aggressive traders may buy now, providing they understand the risks and prepare an appropriate trade plan.
Trade Sample
Entry: $51.80
Stop-Loss: $51.30
Risk: $0.50
Target: $53.80, below highest point of rising channel, the Feb. 20 high
Reward: $2
Risk:Reward Ratio: 1:4
