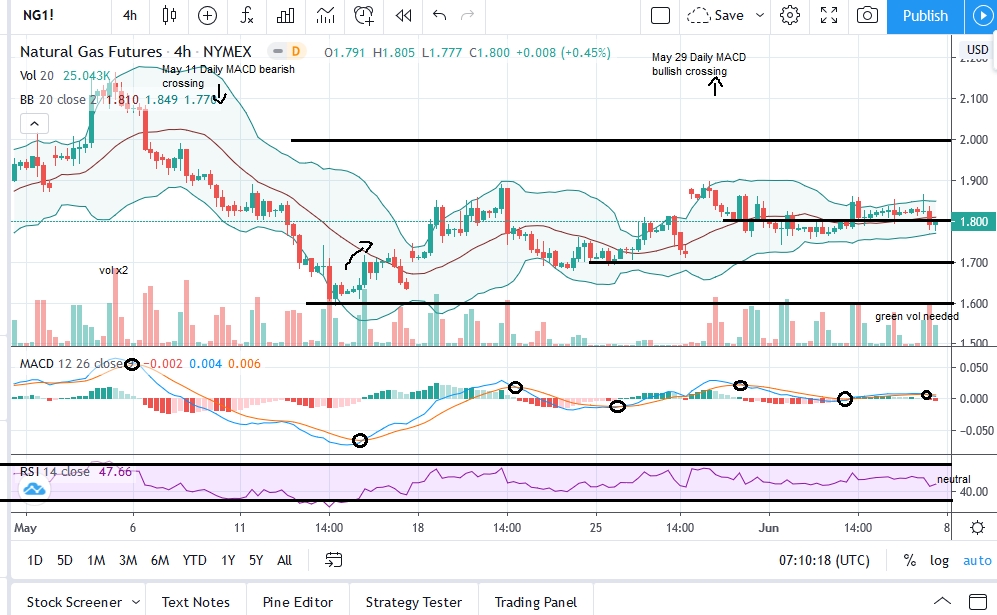
Natural Gas on the Nymex had a volatile week before closing on Friday 2.1% lower than a week ago at $1.80.
EIA confirmed on Thursday a build of 102 Bcf in working underground stocks for the week ended May 29. Stocks are currently 39% higher y/y, 18.4% above the 5-year average. This is the seventh straight week in the refill season both percentages are down. The average underground storage capacity utilization is currently at 64%.
Recently, in the middle of the coronavirus crisis, we have assumed $1.50 is a floor for this market following a rather typical post-winter downtrend. We have identified higher lows and then higher support levels as natural gas likes ranging. The market showed steadiness and the sentiment remains positive following the industry’s consolidation. Trading opportunities are to be found while buying the dips early while most market participants are now expecting a breakout in the uptrend.
A support level at $1.70 – $1.80 has to hold and next we want to see sustained $2.00 – $2.10 during the Dog Days.
We prefer trading the near term charts, re-buying following exhaustion, and gaining profits multiple times from the same ranges. The next 4hour MACD crossing will be an appropriate entry point. Warmer weather across the Lower 48 will offer us a better reference point for the months to follow with further increase in demand for electricity generation for cooling. The market still has to overcome an economic recovery and increasing competition from renewables aiming for the power generation domestic market share which is precious for American natural gas producers. So let’s be careful. U.S. macro data and the U.S. Dollar Index to be routinely monitored. Daily, 4hour, 15min MACD and RSI pointing entry areas.

natgas_chart_6.8.20
Natural Gas: Rebuying Following Exhaustion
Fusion Media or anyone involved with Fusion Media will not accept any liability for loss or damage as a result of reliance on the information including data, quotes, charts and buy/sell signals contained within this website. Please be fully informed regarding the risks and costs associated with trading the financial markets, it is one of the riskiest investment forms possible.
